|
|

NPC & CPPCC Annual Sessions > Biz & Economy > Key Documents
|
Full text of China's 2008 statistical communiqué of economic, social developmentBy (Xinhua)
Updated: 2009-02-27 17:59 III. Industry and Construction In 2008, the total value added of the industrial sector was 12,911.2 billion yuan, up by 9.5 percent over the previous year. The value added of industrial enterprises above the designated size was up by 12.9 percent. Of this total, that of the state-owned and state-holding enterprises grew by 9.1 percent, that of the collective enterprises went up by 8.1 percent, that of the share-holding enterprises increased by 15.0 percent, that of the enterprises by foreign investors and investors from Hong Kong, Macao and Taiwan soared by 9.9 percent and 20.4 percent growth for private enterprises. Analyzed by light and heavy industries, the growth of the light industry was 12.3 percent and that of the heavy industry was 13.2 percent.
In 2008, of the industrial enterprises above designated size, the growth of value added for the mining and washing of coal industry was 19.1 percent over the previous year, for the extraction of petroleum and natural gas was 6.1 percent, for culture and education, sporting goods manufacturing industry 18.2 percent, for gas production and supply industry 26.8 percent, for processing of food from agricultural product 15.0 percent, for manufacture of general machinery 16.9 percent, for manufacture of transport equipment 15.2 percent, for manufacture of communication equipment, computers and other electronic equipment 12.0 percent and for manufacture of electrical machinery and equipment 18.1 percent, for chemical fiber manufacturing industry 2.2 percent. The growth of the value added for the major six high energy consuming industries were 10.0 percent, of which, that of the manufacture of non-metallic mineral products was 16.9 percent, smelting and pressing of ferrous metals 8.2 percent, manufacture of raw chemical materials and chemical products 10.0 percent, smelting and pressing of non-ferrous metals 12.3 percent, production and supply of electric power and heat power 8.6 percent and 4.3 percent for processing of petroleum, coking, processing of nuclear fuel. The value added growth for the high-tech industry was 14.0 percent over the previous year.
The profits made by the industrial enterprises above the designated size in the first 11 months of 2008 were 2,406.6 billion yuan, an increase of 4.9 percent over the same period of last year.
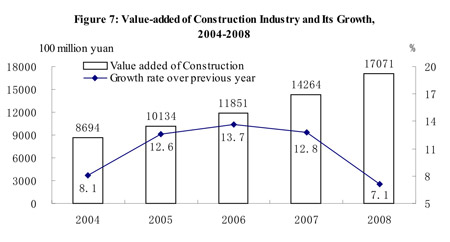
In 2008, the value added of construction enterprises in China was 1,707.1 billion yuan, up by 7.1 percent over the previous year. The profits made by construction enterprises qualified for general contracts and specialized contracts reached 175.6 billion yuan, up by 12.5 percent, of which the profits made by the state-owned and state-holding enterprises were 50.9 billion yuan, up by 21.8 percent. Their paid taxes were 205.8 billion yuan, up by 20.0 percent, of which the taxes paid by the state-owned and state-holding enterprises were 77.1 billion yuan, up by 24.7 percent.
|
       |
闽清县| 石棉县| 克山县| 衡阳县| 大埔区| 康保县| 黄浦区| 灯塔市| 文登市| 济南市| 淅川县| 漳州市| 临海市| 集贤县| 沁水县| 怀仁县| 平谷区| 萨嘎县| 隆安县| 庆安县| 玉树县| 娄底市| 通榆县| 敦煌市| 洛宁县| 商都县| 清镇市| 通化市| 和林格尔县| 兰考县| 沁源县| 湛江市| 丰县| 扶风县| 龙南县| 襄垣县| 江永县| 突泉县| 大冶市| 喀喇| 广昌县|