


We have launched E-mail Alert service,subscribers can receive the latest catalogues free of charge

An Analysis of China’s Investment Ratio
2005-12-16


Li Shantong, He Jianwu & DuanZhigang, Department of Development Strategy and Regional Economy of DRC Research Report No.151, 2005
Since reform and opening-up, China has achieved an average annual economic growth of 9.4%. It is close to that of Japan and the “four little tigers” in Asia during the periods of their economic taking off [1]. However, maintaining such a high rate of growth in a long period of time is unusual worldwide. Analysts of China’s economic growth generally regard rapid accumulation of capital as the key source of China’s continuously fast economic growth in the past 20 years[2]. Historical data demonstrates that while China’s economy grew rapidly, its investment ratio also remained a high level, putting the issue of “high investment ratio” a hot topic for debate and research. This article tries to explore the roots of the presently high investment ratio and the trend of future investment ratio in China through a worldwide comparison on variation tendency of investment ratio, investment structure and investment ratio.
I. Historical Trends of Investment and Consumption and Their Current Patterns
In general, investment ratio refers to the rate of totalcapital formation, namely a percentage of gross capital formation (including increases in fixed capital and inventory) in GDP, which is calculated with expenditure approach. The ratio of consumption refers to the final ratio of consumption, namely the percentage of final consumption (including household consumption and government consumption) in GDP.
Fig. 1 shows that since 1978, China’s investment ratio basically stayed between 30%-45%. The highest ratio during 1978-2000 was found in 1993, which reached 43.5% (except particularly indicated, all data for 2004 came from China Statistical Summary 2005); the lowest ratio was found in 1982, which reached 32.1%, and the average ratio was 37.3%. In recent years, investment ratio had kept rising, especially in 2004, when it reached a record high of 43.9%. The gross capital formation includes the growth of fixed capital and inventory. In fact, the ratio of fixed-capital formation can best reflect the economic impact of investment. If considering the fixed-capital formation and the variation of inventory separately, we can see that the ratio of inventory basically stayed at a high level before 1990s. However, since 1990s, especially after 1995, the proportion of inventory in GDP continued to fall, and the variation of inventory approached to zero since beginning of this century. The average ratios of fixed-capital formation were 28.97% in 1980s, 33.27% in 1990s (about four percentage points higher than 1980s), and up to 39.69% since beginning of this century. The ratio of fixed-capital formation dropped to its lowest in 1997 along with the “soft landing of the economy”, and rose again with the adoption of active financial policies afterwards. As a result of annual decrease in inventory variation, the ratio of gross capital formation dropped to its bottom in 2000. Because inventory basically varied at a very low speed thereafter, the ratio of gross capital formation rose along with the growth of the ratio of fixed capital formation. The tendency of the ratio of fixed-capital formation in recent years basically synchronized that of gross capital formation (i.e. investment ratio). Therefore, in our analysis below, we sometimes use the ratio of fixed-capital formation to unveil the characteristics of variation of investment.
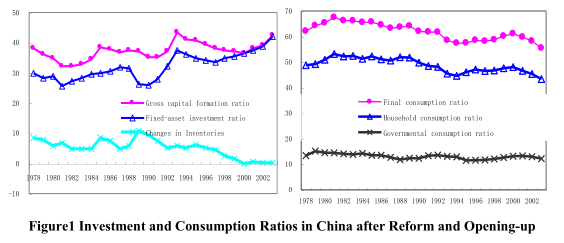
According to Fig 1, consumption ratio experienced a process of change opposite to that of investment ratio. The level of consumption ratio since the 1990s was lower than before. Average consumption ratio was 65.21% in the 1980s, 59.45% in the 1990s (about six percentage points lower than the 1980s), and down to 57.63% since this century. In term of the two major components of the consumption ratio, both final household consumption and government consumption declined. In particular, the final household consumption ratio dropped from 51.75% in the 1980s to 47.04% in the 1990s, and went down further to 45.03% since beginning of this century.
…
If you need the full text, please leave a message on the website.
--------------------------------------------------------------------------------
[1]Compared with the 20-year period of economic taking off (1961-1981) of China Hong Kong, Japan, Korea, China Taiwan and Singapore, GDP growth of Mainland China is slightly lower than China Taiwan (10.0%), equivalent to China Hong Kong (9.6%) and Singapore (9.5%), and two percentage points higher than Japan.
[2]According to the findings of our most recent research (2005), annual growth of capital in China during 1978-2003 reached 9.9%, promoting GDP growth by about six percentage points, and contributed 63.2% to economic growth.