Daryl Guppy
Charting a double dip in stock markets
By Daryl Guppy (China Daily)
Updated: 2010-07-05 09:54
 |
Large Medium Small |

The debate about a double dip in Western markets has already been resolved in China markets this week. The fall below 2500 is a key indication that a large-scale double dip in markets is developing. The price behavior in the past two weeks in both British and American markets has all but confirmed the development of a double dip. The collapse of the Shanghai market below 2500 has acted as an early warning signal because the strategic behavior of the Shanghai market continues to lead the behavior of world markets.
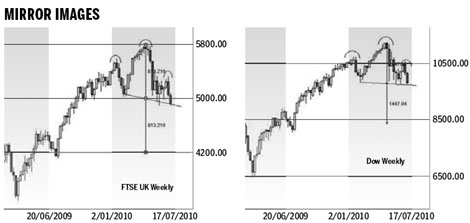
The rally that started fourweeks ago in Western markets has collapsed convincingly in the past two weeks. The rally retreat is significant because it completes the third component of a long-term chart pattern. Both the FTSE and the Dow have developed a head and shoulder chart pattern. This is the same pattern that developed in the Dow in late 2007. It gave early warning of the dramatic market collapse in 2008. Both the FTSE and the Dow developed inverted head and shoulder patterns as part of the market reversal in 2009.
There are two factors which have come together and they need to be considered separately. First is the relationship between the Shanghai market and the rest of the world. Second is the significance of the head and shoulder pattern and the way it is used to establish downside targets.
Where Shanghai goes, the Dow follows, although the details of the path taken are different. The failure of Shanghai support near 2500 shows a continuation of the market fall and the development of a major double dip. Successful support consolidation near 2500 indicated a smaller double dip around 25 percent. The cascading fall now has a downside target near 2200, which suggests a major double dip of around 35 percent. This behavior is duplicated in Western markets although the size of the dip may be smaller.
This has an impact on the message from the head and shoulder pattern with the Dow and the FTSE. It suggests that after the initial pattern targets are achieved, there is now a higher probability that these markets will also cascade to lower levels. It suggests that the FTSE and Dow retreats have a higher probability of developing into a major double dip.
| ||||


The rally peaks in the FTSE appear in January and April and June. The height of this pattern is 810 index points. The downside projection for this pattern sets a target near 4200 for a retreat of 27 percent. A weak support level is near 4700. It is relatively easy to break this support level and develop the cascade pattern seen in the Shanghai market.
The rally peaks in the Dow appear in January and May and June. This head and shoulder pattern is 1450 index points in height. The downside projection taken from the neckline of the pattern sets a target at 8400. This is a 25 percent decline. The Dow may develop support near 8700 and then cascade in a collapse to 8400.
The pattern is invalidated by a fourth rally that rises above the peak level of the right shoulder. The pattern is confirmed with a close below the value of the neckline.
The good news for investors comes from the Shanghai market. As in 2008, the Shanghai market will be the first market to develop a new trend breakout. Western investors who follow this market behavior will have an early warning of what to expect in the FTSE and the Dow.
The author is a well-known international financial technical analysis expert.