Daryl Guppy
Charting increasing volatility of the greenback
By Daryl Guppy (China Daily)
Updated: 2010-03-29 07:54
 |
Large Medium Small |
In recent months the downtrend in the US Dollar Index has reversed direction and developed a steady uptrend from the low near $0.75 in December 2009. The Dollar Index encountered resistance near $0.81.

This has resulted in a small trading consolidation band between $0.80 and $0.81. Last week the Dollar Index broke above this level and moved to $0.82. This signals a potential uptrend move to $0.85.
The dollar Index chart provides some insights into the valuation of the US dollar, and ultimately its position as a global reserve currency.
Unlike the stock market, there is not a free market in currencies. The price of a currency is not set by the same price discovery methods that are found in stock exchanges.
Currencies trade in a global market place but many of the market participants do not have a choice when it comes to their involvement. Banks and central banks are obliged to become involved in currency trading because they must take the opposite side of their customers foreign currency transactions.
When you buy a book from Amazon your bank is obligated to buy US dollars to settle your transaction.
The supply of currency is controlled by the national sovereign banks, which have a monopoly on the creation of money. During the global financial crisis many of these sovereign banks, notably the US Federal Reserve and the Bank of England, accelerated the printing of money.
This led to fears of currency debasement and inflation. The American Federal Reserve has total control of the supply of US dollars and this gives it dominant influence over the value of the US dollar and, in turn, the terms of trading for its trading partners.
Many countries choose to ally their currency with the US dollar, just as European countries choose to peg their currencies to the Euro. This is supposed to create a more stable exchange rate.
It is ironic that a fixed-rate system means a country essentially surrenders some of its monetary and policy making independence because the key monetary decisions are made by a foreign central bank.
There is a perception that the US dollar is a fixed value but the dollar index shows substantial changes in dollar valuation and increasing trend volatility.
The US dollar has become a volatile floating currency and many people have difficulty coming to terms with this development. Stability or instability in the US dollar is a primary driver of global currency stability.
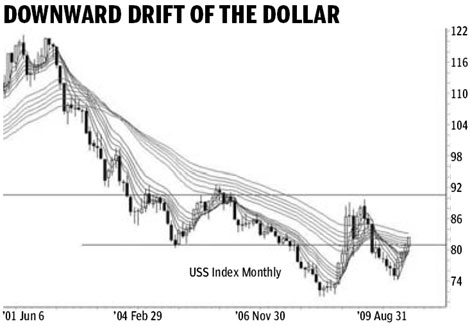
The floating volatile character of the US dollar is seen on the monthly Dollar Index chart. It shows the dollar is locked in a substantial downtrend since 2002 when the Dollar Index fell from $1.20 to $0.81 before a rally to $0.91 followed by a continuation of the downtrend and a fall to $0.71 in 2008. The monthly chart shows that $0.81 is a critical support level in 1994 and 2005. Now it is an important resistance level.
The most important change in the dollar index chart is the substantial increase in trend volatility in July 2008 with a rapid rebound from $0.71 support to a high of $0.88.
This was followed by sharp retreat and rebound in early 2009. The remainder of 2009 was dominated by a fall from $0.88 to the low near $0.75 in December 2009. The devaluation of the dollar has the effect of increasing the competitiveness of US exports.
The current rebound trend must be seen in the context of the long-term downtrend and the recent increase in volatility. A significant trend change is signaled when the dollar index remains above $0.81 and a new rally re-tests resistance near $0.88. This development would confirm the end of the Dollar Index downtrend and the creation of a new uptrend with the potential for the dollar index to test consolidation resistance levels between $0.95 and $0.96. Although these levels are higher than recent lows, they are still 20 percent below the peak US dollar index value of $1.20 in 2001.
Failure to stay above $0.82 confirms a continuation of downtrend pressure on the US Dollar Index. This signals a retest of the lows near $0.74 and potentially the lows near $0.72. Until a clear trend breakout is confirmed the dollar index will continue to reflect a condition of currency instability.
A stable exchange rate is more difficult to achieve when the value of the currency reference point develops increased volatility.
The author is a well-known financial technical analyst.